2025-03-03 Final Delivarable Watchdog project
2025-03-03 Final Delivarable Watchdog project1. AI Model for LIDAR point-cloud enhancement2. Backend API for Watchdog App3. Frontend for Watchdog App4. Initial Linux-based Watchdog App
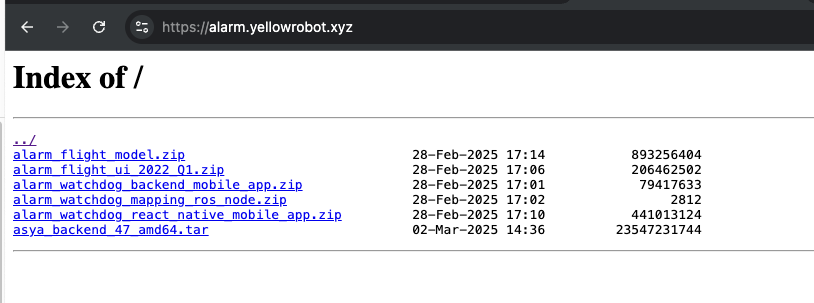
https://alarm.yellowrobot.xyz/
21u: alarm2p: PpQO4E14u19gvCOdi85L
1. AI Model for LIDAR point-cloud enhancement
AI model was made to enhance the point-cloud data in 2D for better visualization and detection of walls and rooms using cheaper LIDAR sensors. Initial point-cloud data was gathered using mapping phase of the SLAM algorithm. Then enhanced version was used in the Watchdog App. To convert coordinates from enhanced point-cloud to the original point-cloud, transformation matrix was used which also came as the output of the model.
Initially while building the model we tested Pix2Pix type of models like UNet, UNet++ and others, but finally found that Generative Adversarial Networks (GANs) are more suitable for this task.
For the model StarGAN, CycleGAN and BicycleGAN have been used for experiments. The best results have been achieved using BicycleGAN with several passes. Model was capble of filtering point-cloud, closing gaps and fixing SLAM defects like curved hallways. We later improved BicycleGAN by using Wassersteing GAN loss.The discriminator doesn’t use any activation in the end. It’s a real valued score with a gradient penalty term added to the critic's loss to enforce the Lipschitz constraint. (penalize the norm of gradient of the critic with respect to its input vs just clipping). A common point of confusion is that a perfect critic model will output -1 for every fake image and +1 for every real image. However we want the critic model to output larger scores on average for fake images and smaller scores on average for real images. We then designed a loss function to encourage this outcome. For discriminator as encoder PatchGAN was used.
The model consist of 2 parts, the GenAI model that takes as input 2D projection of the point-cloud and outputs enhanced 2D projection (alarm_flight_model.zip) and the second part is the Wall detector that takes enhanced 2D projection and outputs detection of walls and rooms (asya_backend_47_amd64.tar). Second part is implented in backend of the Watchdog App.
| Raw Point-Cloud | GenAI Point-Cloud | Wall detection | Room detection |
|---|---|---|---|
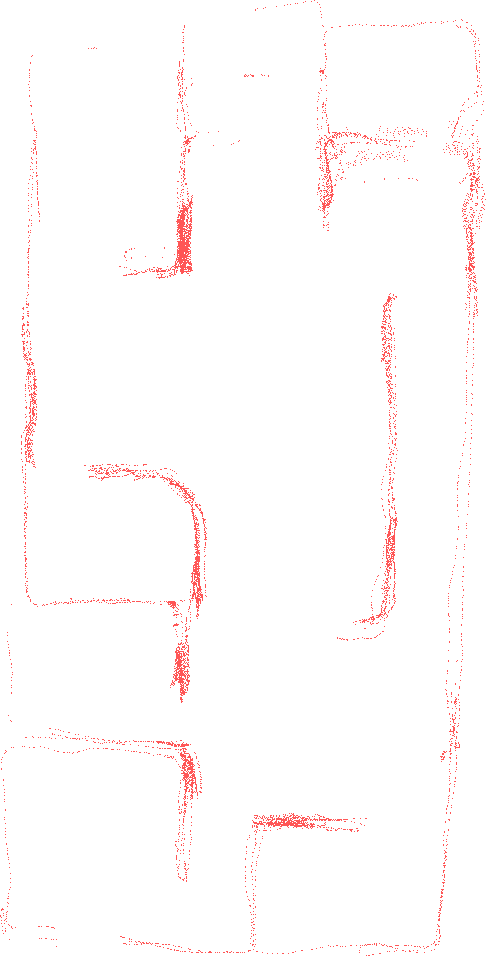 | 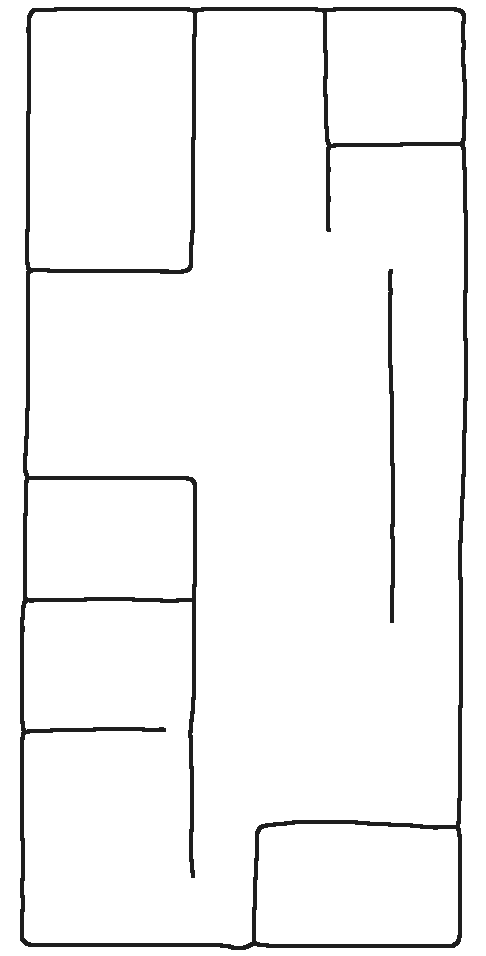 | 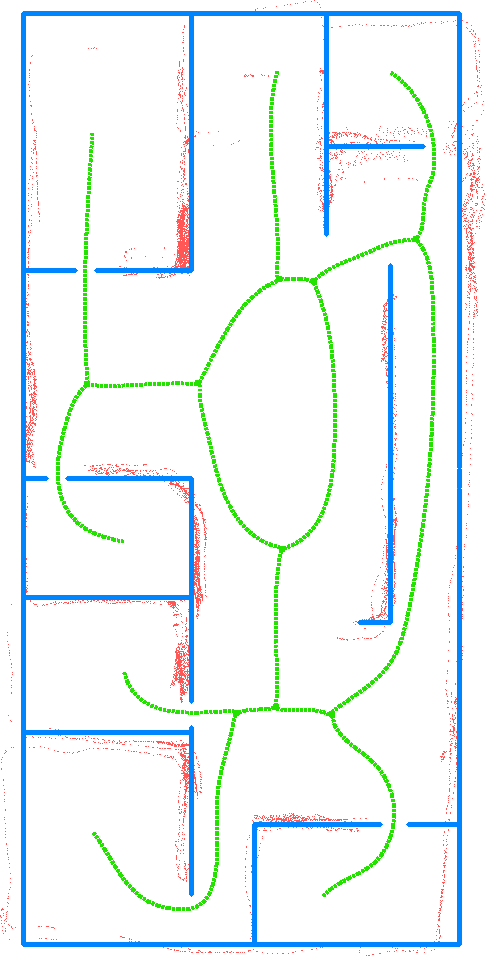 | 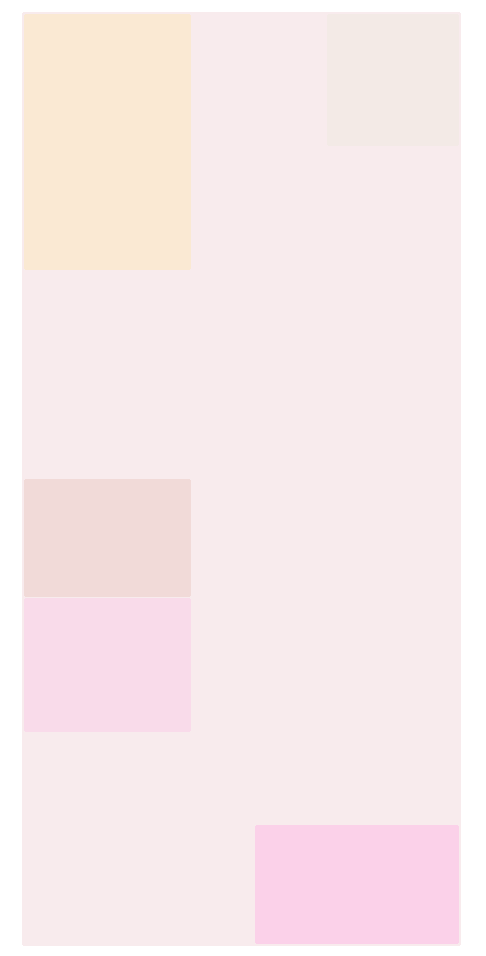 |
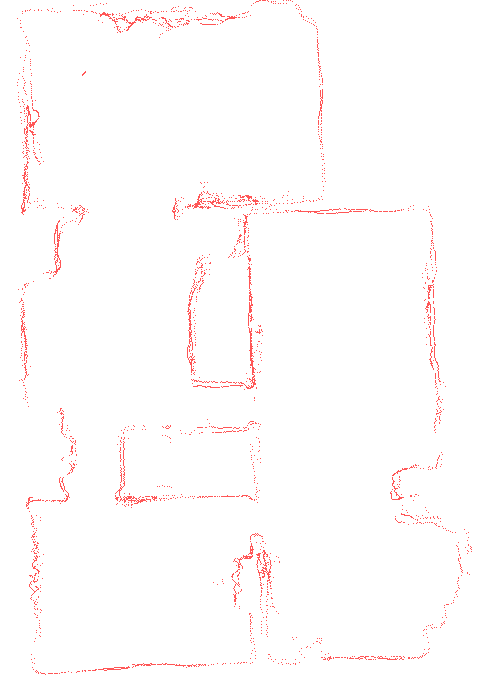 | 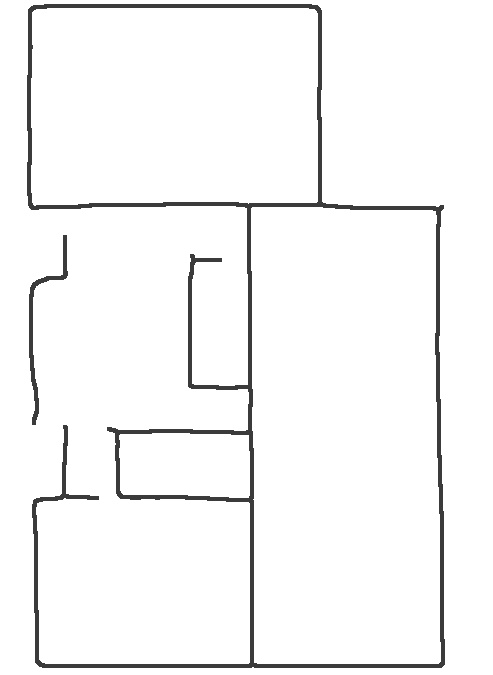 |  |  |
 | 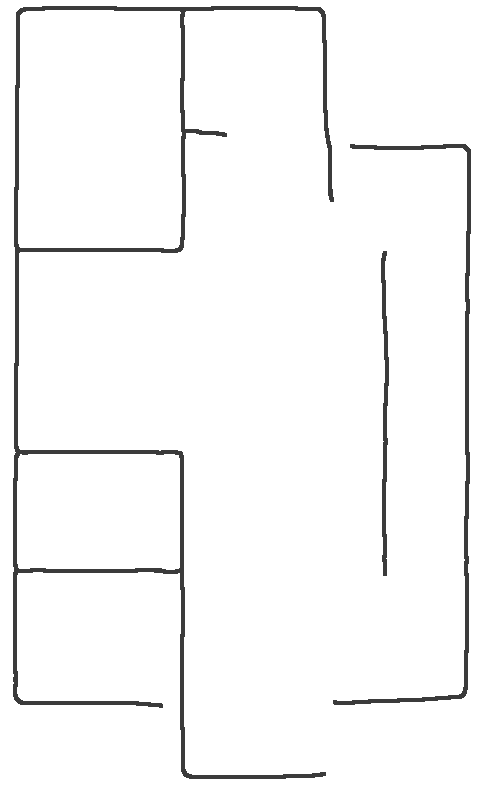 | 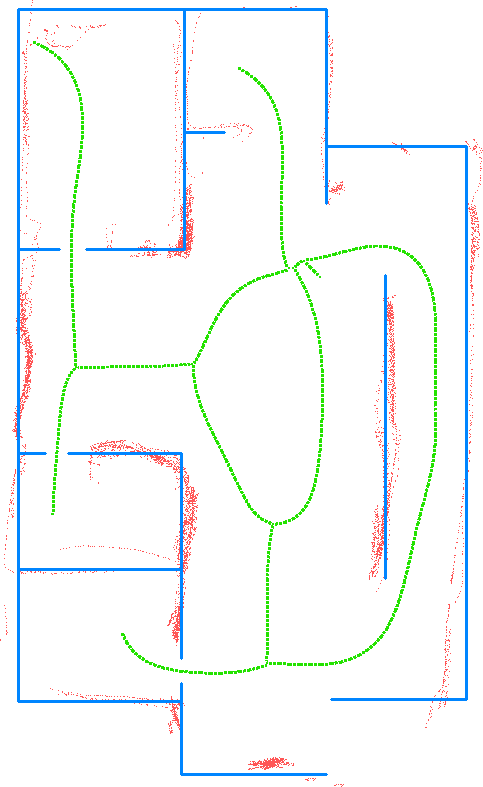 | 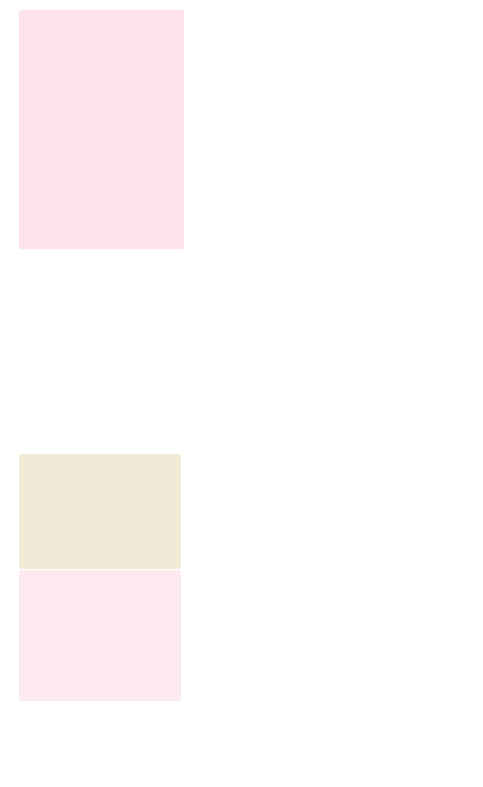 |
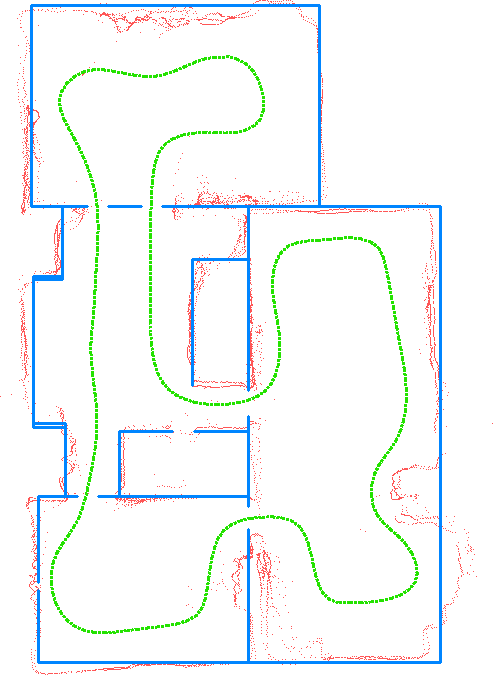
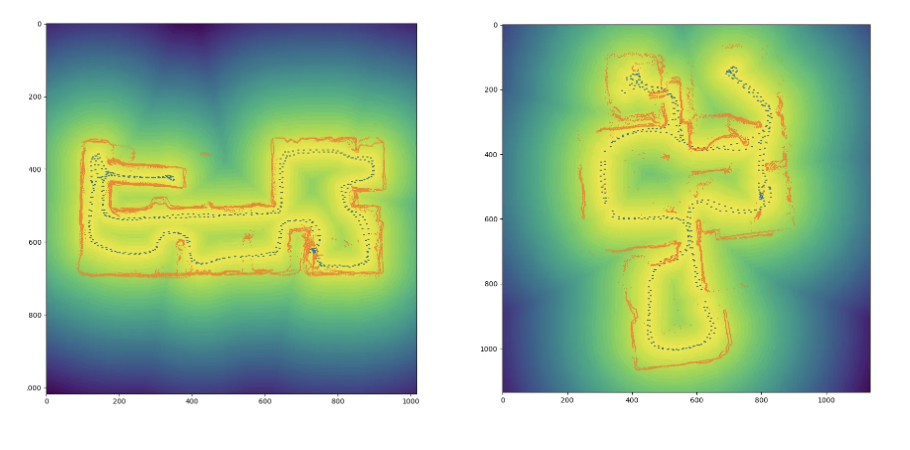
Example below shows GenAI nature of the model where it can not only complete the missing parts of the wall, but also create a new wall where there is none and even straighten coridors that have been deformed by the SLAM algorithm.
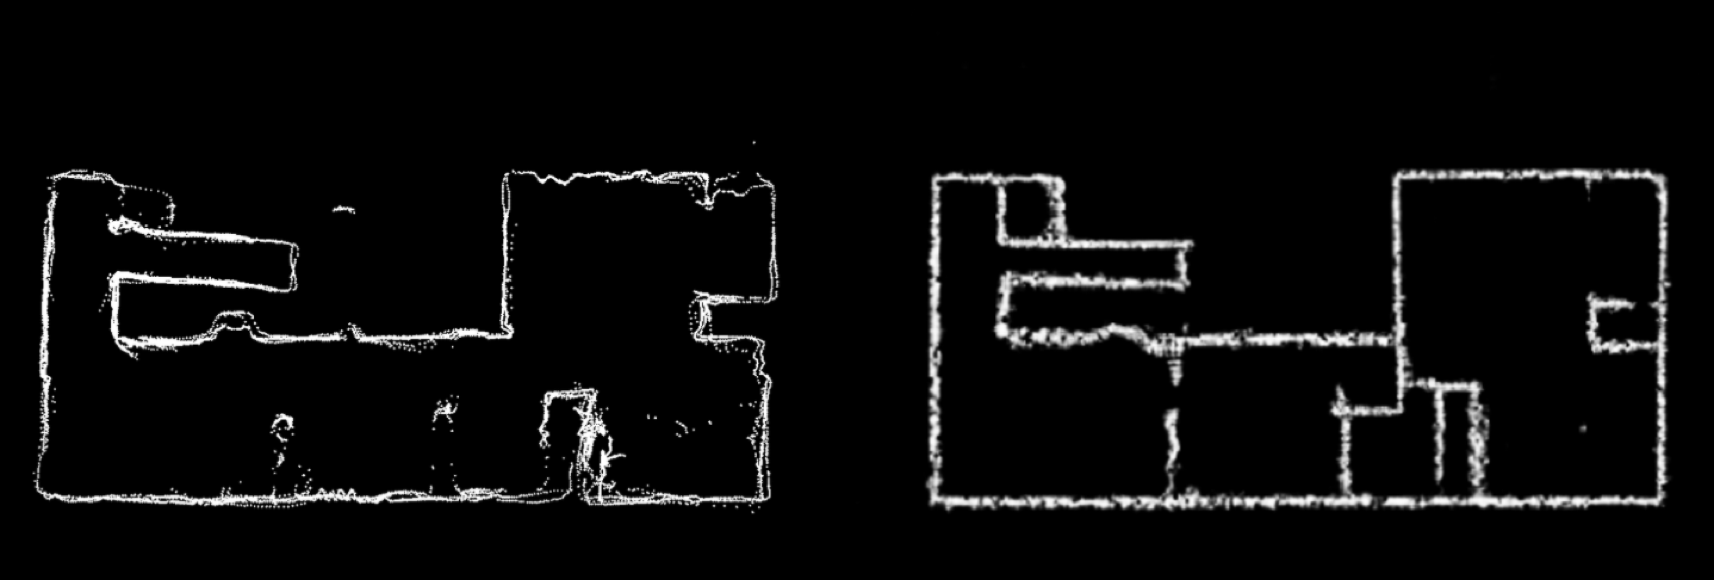
System is capable to infer defects in point-cloud projection based on learned priors from other floor plans.
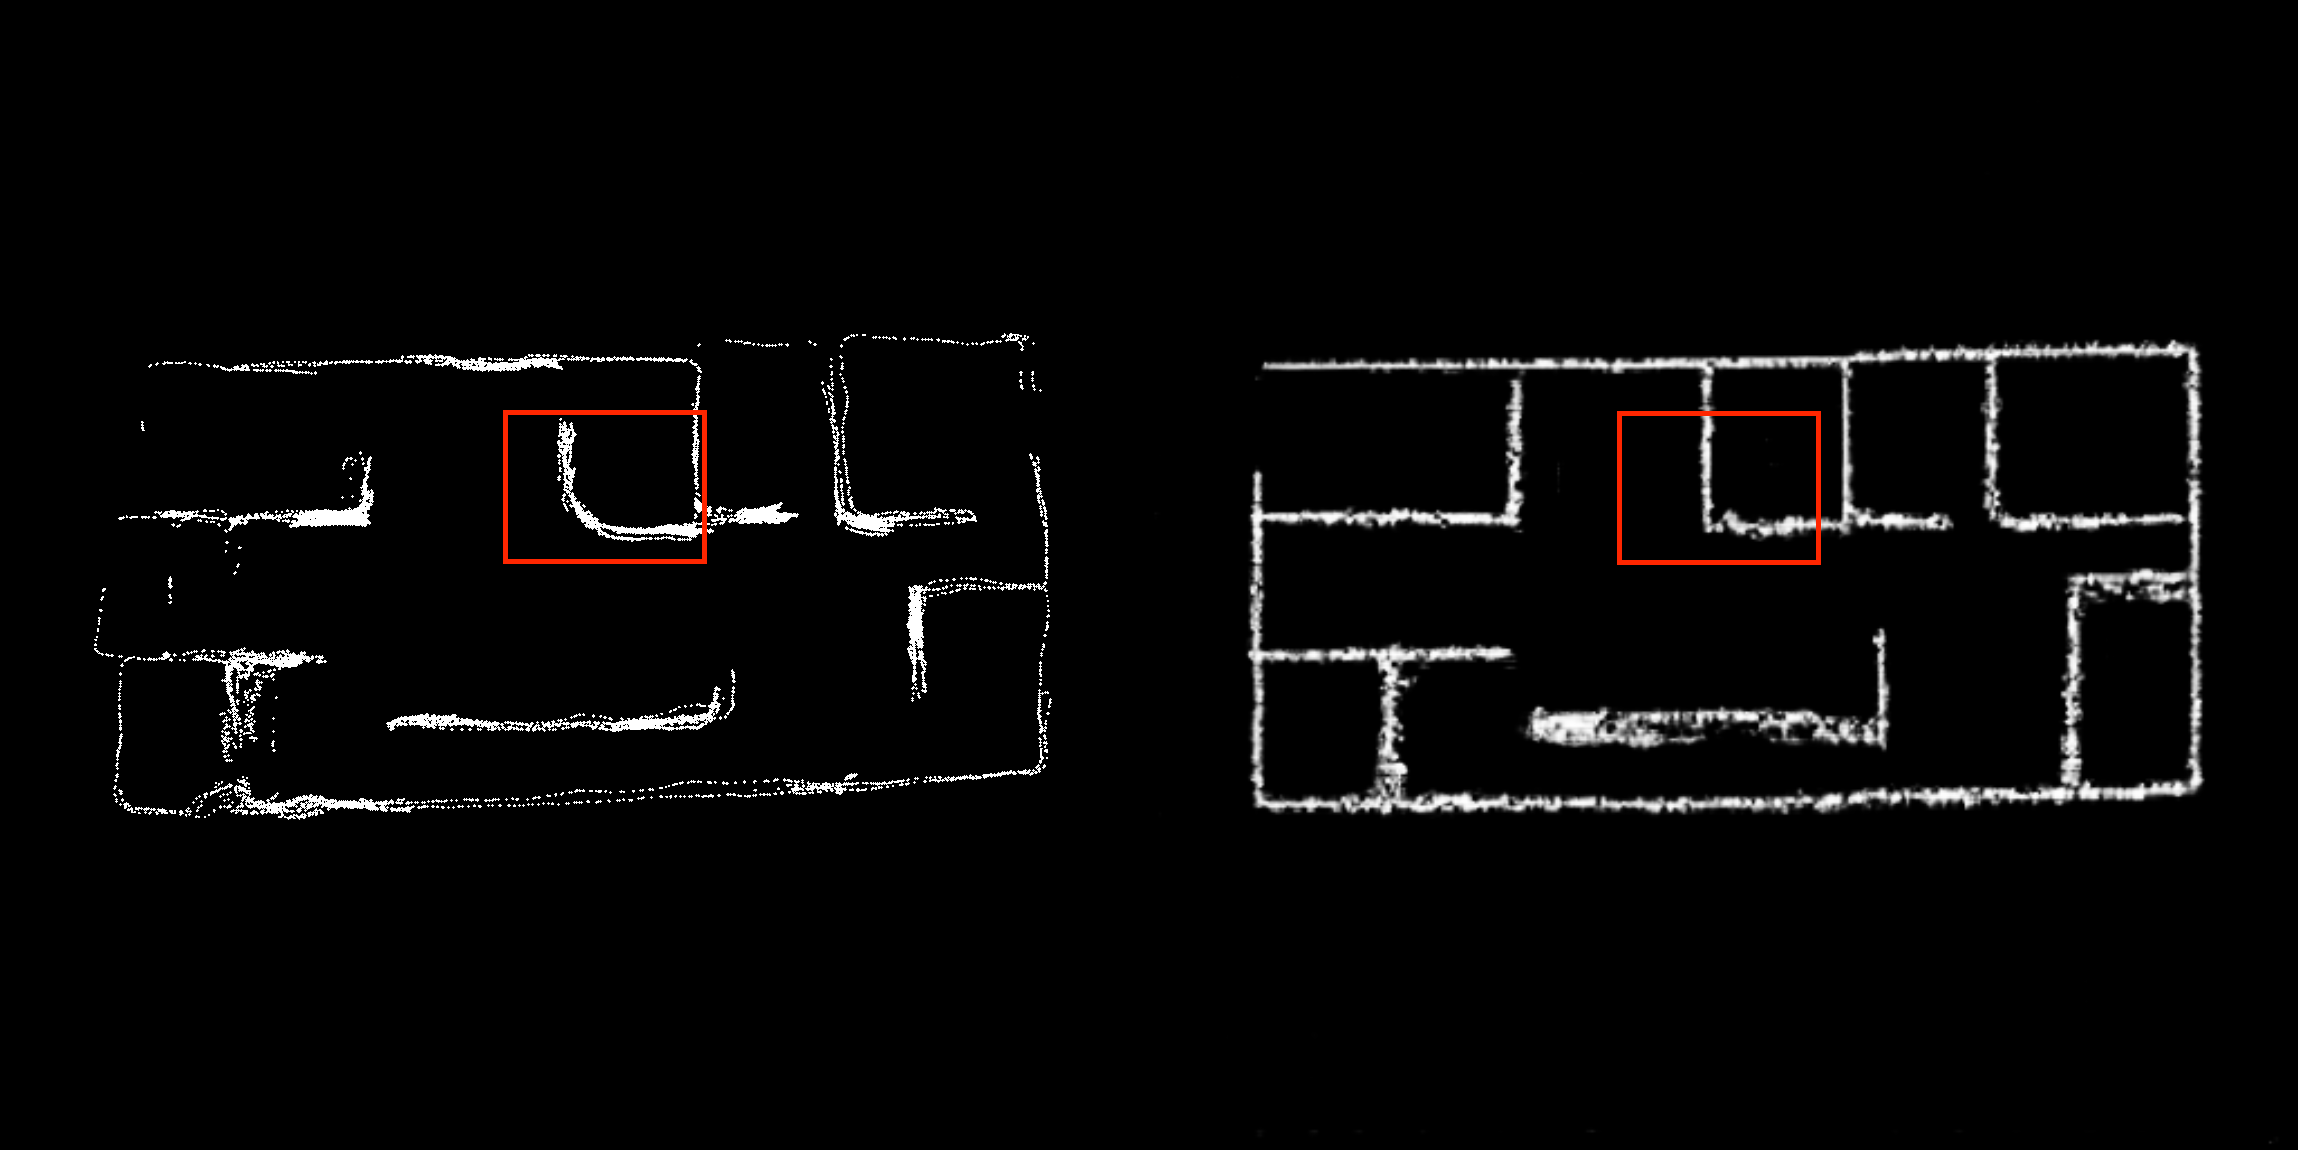
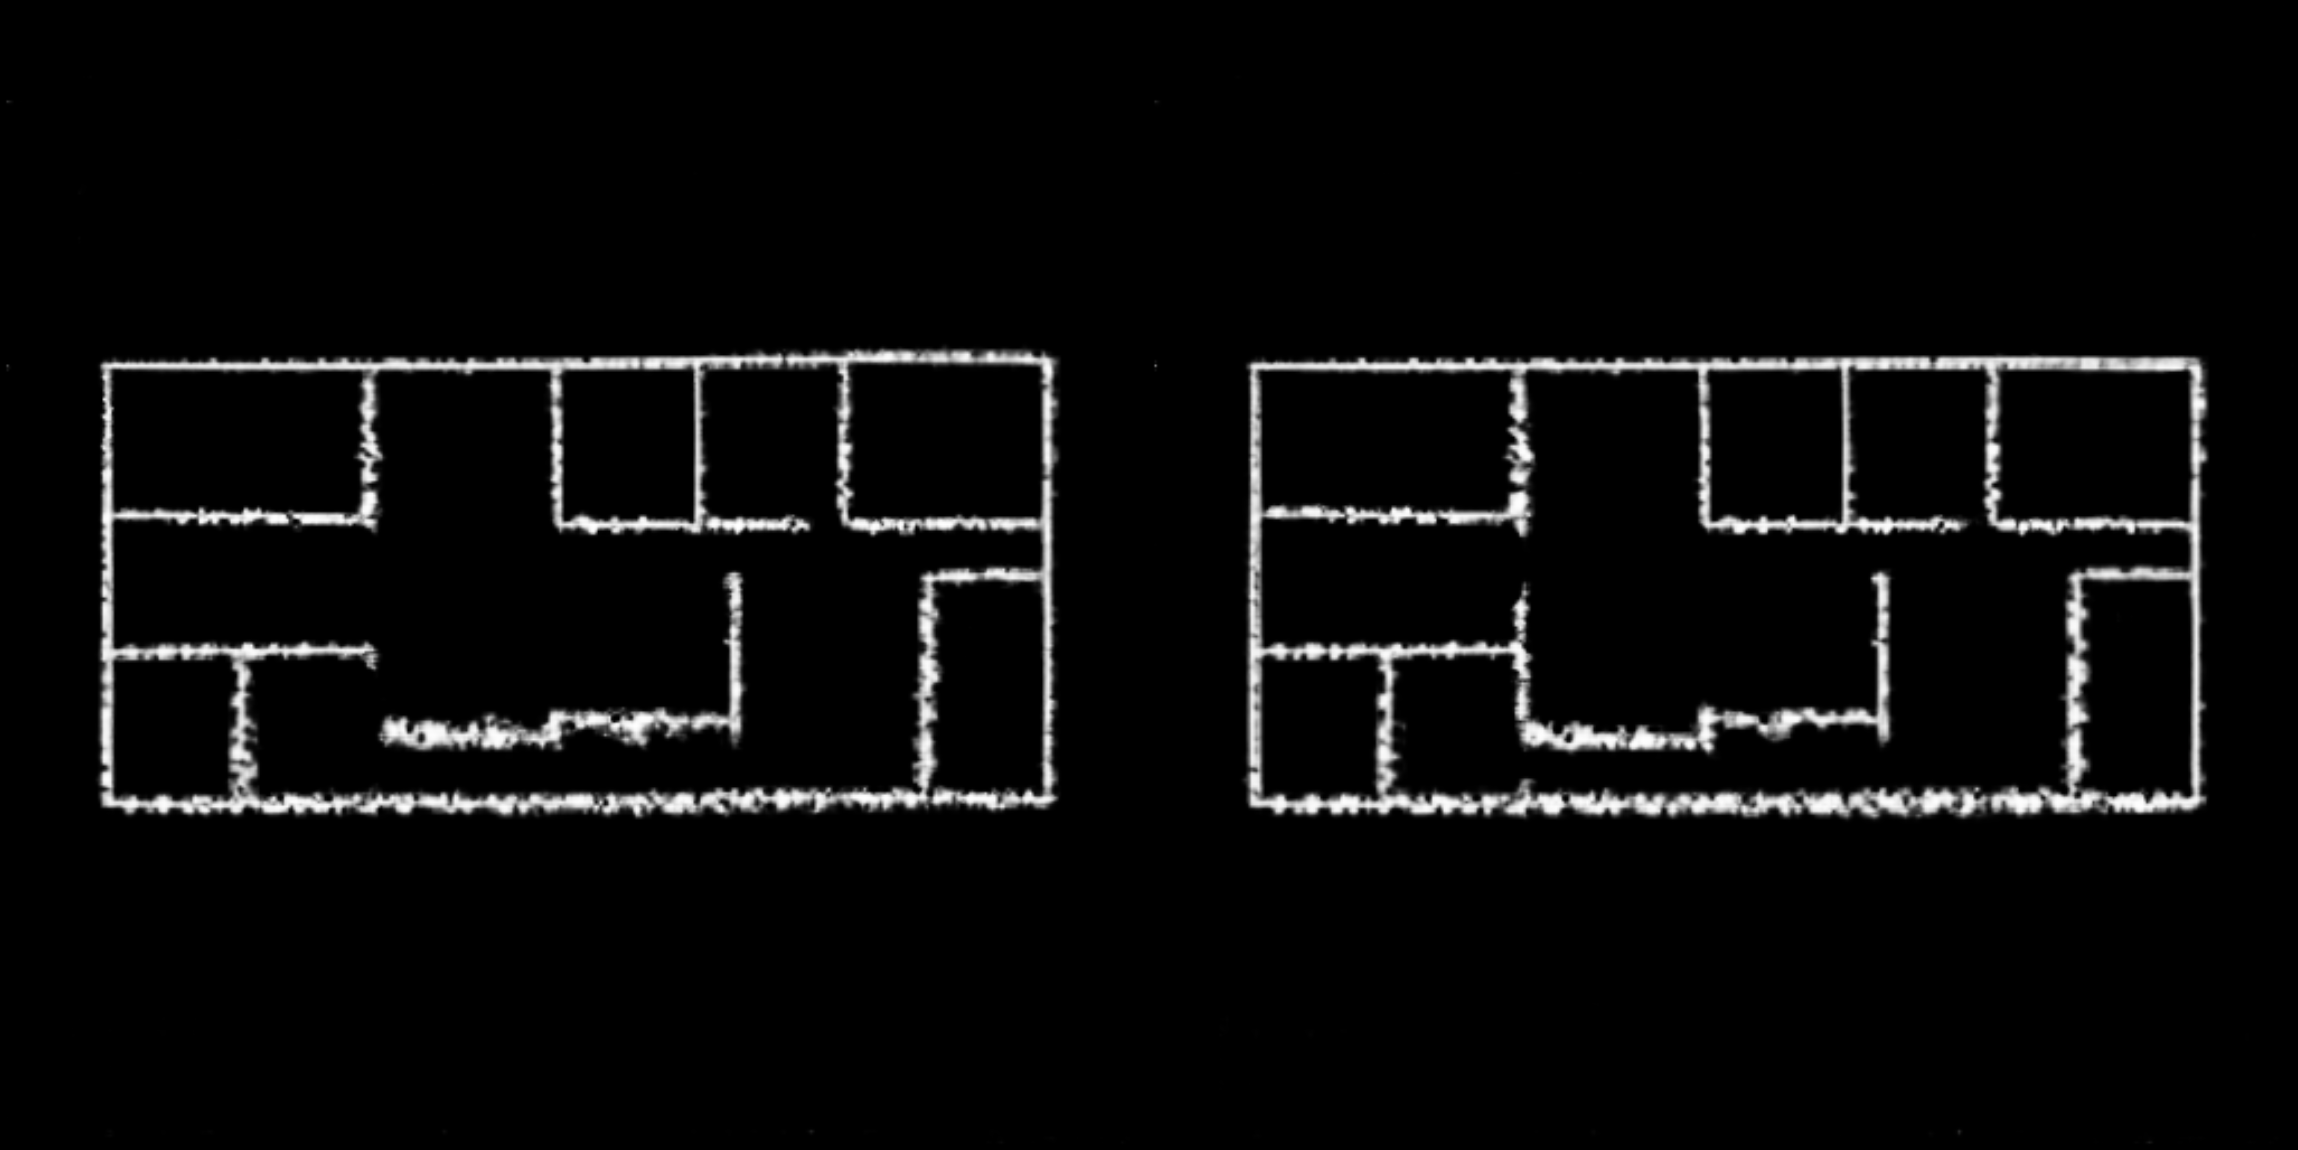
System is capable capable to keep imporving output by auto regressively feeding output back in to the model as shown in example below.
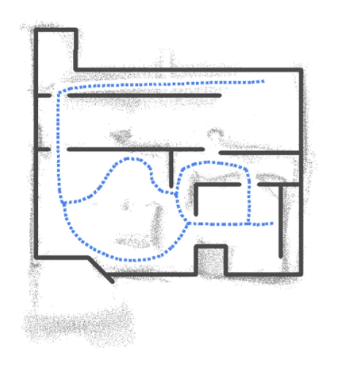
Drone path maps were used as one of the input feature maps. Each pixel intensity represents the distance to the nearest point on the drone path. This method helps to predict existance of walls where there are missing parts in the point-cloud data.
Three distinct datasets were utilized for synthetic data generation. A total of 623 ground-truth floorplan images were selected, and, through the application of generation and augmentation techniques, 188,908 data samples were produced. These samples were further augmented during each iteration of model training.
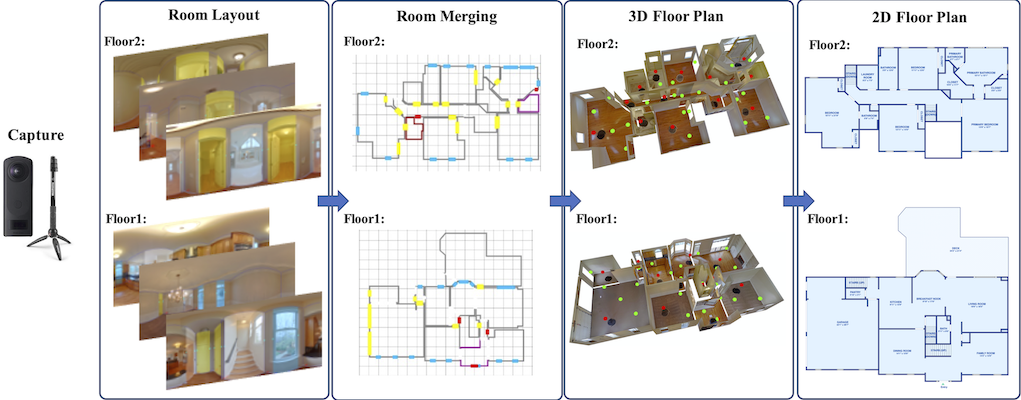
The Zillow Indoor Dataset (ZInD) was utilized in the generation of synthetic data. ZInD represents a comprehensive repository of indoor residential data, comprising 71,474 panoramas obtained from 1,524 real unfurnished settings. The dataset offers extensive annotations, including three-dimensional room layouts, two-dimensional and three-dimensional floor plans, the precise positioning of panoramas within these floor plans, as well as the locations of windows, doors, and openings.
https://github.com/zillow/zind
The ROBIN dataset (Repository Of BuildIng plaNs) is a publicly available dataset designed for floor plan retrieval tasks. It comprises 510 floor plan images that are annotated based on the number of rooms and the overall architectural style of the building. Specifically, the dataset includes floor plans that represent three distinct categories of residential buildings, characterized by having 3, 4, or 5 rooms.
https://github.com/gesstalt/ROBIN
The CVC-FP dataset is a floor plan database specifically developed for structural floor plan analysis and interpretation. It comprises 122 scanned floor plan documents organized into four distinct subsets based on their origin and style. The dataset includes documents with a range of qualities, resolutions, and modeling approaches, thereby serving as a robust testbed for evaluating the efficacy of various analysis techniques. http://dag.cvc.uab.es/resources/floorplans/
For the training of the model synthetic data was used. It was generated from real-life floorplans and then heavily augmented.
System is also capable of using 3D point-cloud not only 2D projections to improve quality of final result. For example sloped wall detection has been implemented.
Below there is visualization of sloped wall detection.
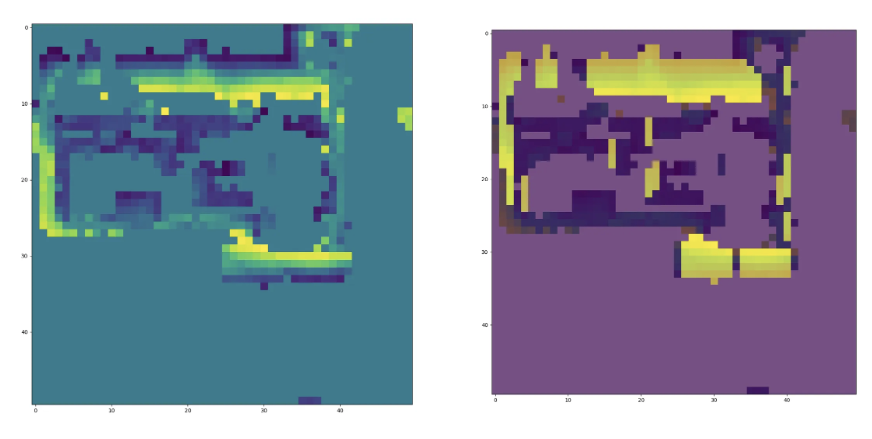
Map visualization before and after sloped wall detection.
 |  |
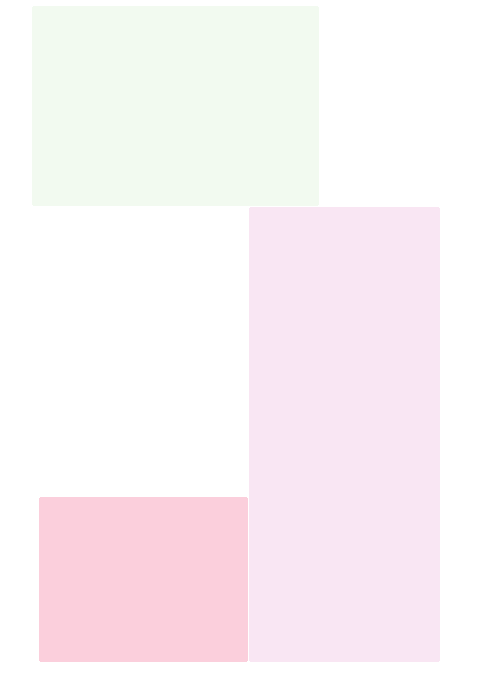
We also validated point-cloud maps generated by iPad-based 3D scanning. The results showed a higher point density compared to TOF maps—approximately 700,000 points versus roughly 100,000 or fewer in an average TOF map—which also implies a larger file size (around 100 MB). However, although the walls are distinctly visible, there is insufficient coverage along the drone path. The presented images reveal considerable gaps between the wall segments. Notably, on the right side, only a small segment exists in the middle, while the remaining area is devoid of wall representation. Consequently, despite the higher point count, the overall quality of the point-cloud map is inferior to that of an average TOF map.
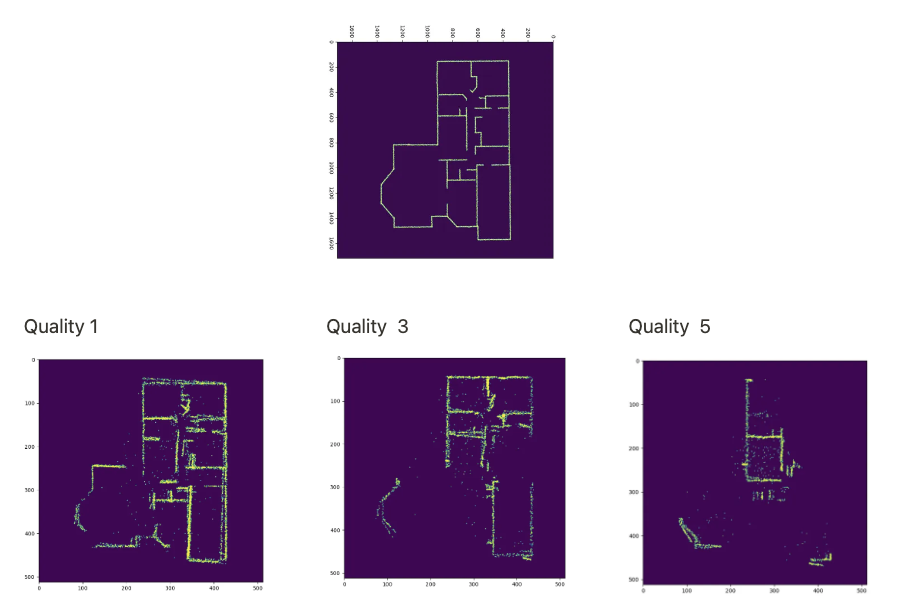
For validation dataset real-world data samples were used from actual mapping runs. To establish model and LIDAR scan quality metrics were created and maps were ranked form best to worst quality. It was intended to use these metrics to hint which parts of the map should be re-mapped and also how fit is the map for the training of the model. It was planned that in future real-life data would be combined with the synthetic data to train the model. During the project real-life data was used only to validate the model. In total we had 13 TOF 3D point-cloud maps and 14 2D point-cloud maps.
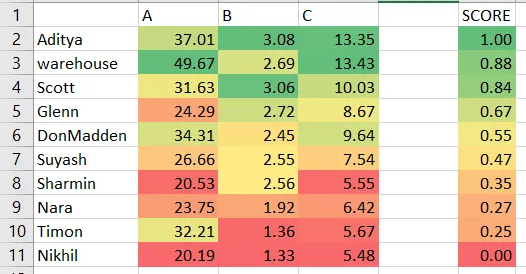
A - relative point density - how many neighbouring points, on average, are within a 0.1m radius of each point.
B - sparse point presence - per how many points a scarce point appears (one whose density is less than 10% of the highest density on the map)
C - points per unfiltered line candidates, describes the accuracy of wall representation
Subjective grouping:
1.) Sharmin, Nara, Timon, Nikhil - a human wouldn’t be able to reconstruct the floorplan (guessing involved), not enclosed (large gaps with no clues what is there), noise occurrences and true walls are often distorted
2.) Glenn, DonMadden, Suyash - clearly recognizable walls, not entirely enclosed (small gaps that are clearly windows, doors..), noise occurrences and distorted walls
3.) Aditya, warehouse, Scott - clearly recognizable walls, few gaps or noise occurrences
2. Backend API for Watchdog App
Specific ROS package with action to support mapping process was also created (alarm_watchdog_mapping_ros_node.zip). It was meant to control steps necessary for the mapping process in the mobile app.
Backend app is implemented using FastAPI and file system to store maps. It was packed as a docker container and deployed on a server alarm.asya.ai (asya_backend_47_amd64.tar)
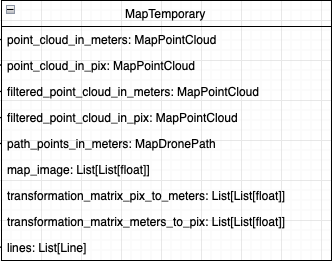
Data structures holding map data are listed below:
point_cloud_in_meters: holds point cloud in meters; is initialised directly from the provided .txt file
point_cloud_in_pix: holds point cloud in meters; is initialised from point_cloud_in_meters after conversion to pix
filtered_point_cloud_in_meters: holds filtered point cloud in meters; is initialised from filtered_point_cloud_in_pix; is used for debugging purposes and perform DBSCAN for further noise reduction
filtered_point_cloud_in_pix: holds filtered point cloud in pix; is initialised from map_image by using cv2 blob detector to remove noise
path_point_in_meters: holds drone path in meters; is initialised directly from provided .txt file
transformation_matrix_pix_to_meters: is initialised during first map point conversion from meters to pix; used to convert all points from pix to meters
transformation_matrix_meters_to_pix: is initialised during first map point conversion from meters to pix; used to convert all points from meters to pix
lines: holds all detected lines from map_image, later this list is pruned; is initialised after applying Hough transform to de-noised map image

In later phases of the project also FastAPI based backend was implemented (alarm_watchdog_backend_mobile_app.zip) to support user system and presistant storage of the maps in the cloud rather in phone storage. It was implemented using FastAPI and PostgreSQL.
3. Frontend for Watchdog App
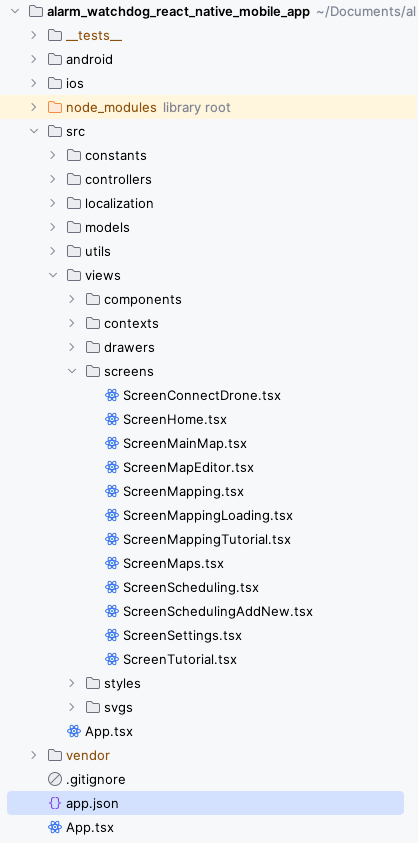
Frontend was implemented using React Native (alarm_watchdog_react_native_mobile_app.zip). It was implemented to handle mapping and control of the drone. It was also able to autonomously execute surveying missions when it was connected to the drone. The plan was to move mission control to the backend at some point in the future.
Application is made using React functional components and hooks, but at the same time Model View Controller (MVC) architecture is used to separate parts of the code. App has been implemented in TypeScript.
Main screens are:
ScreenConnectDrone - Special mode to connect to the drone for the first time. It requires user to enter the drone IP address and then connect to the drone.
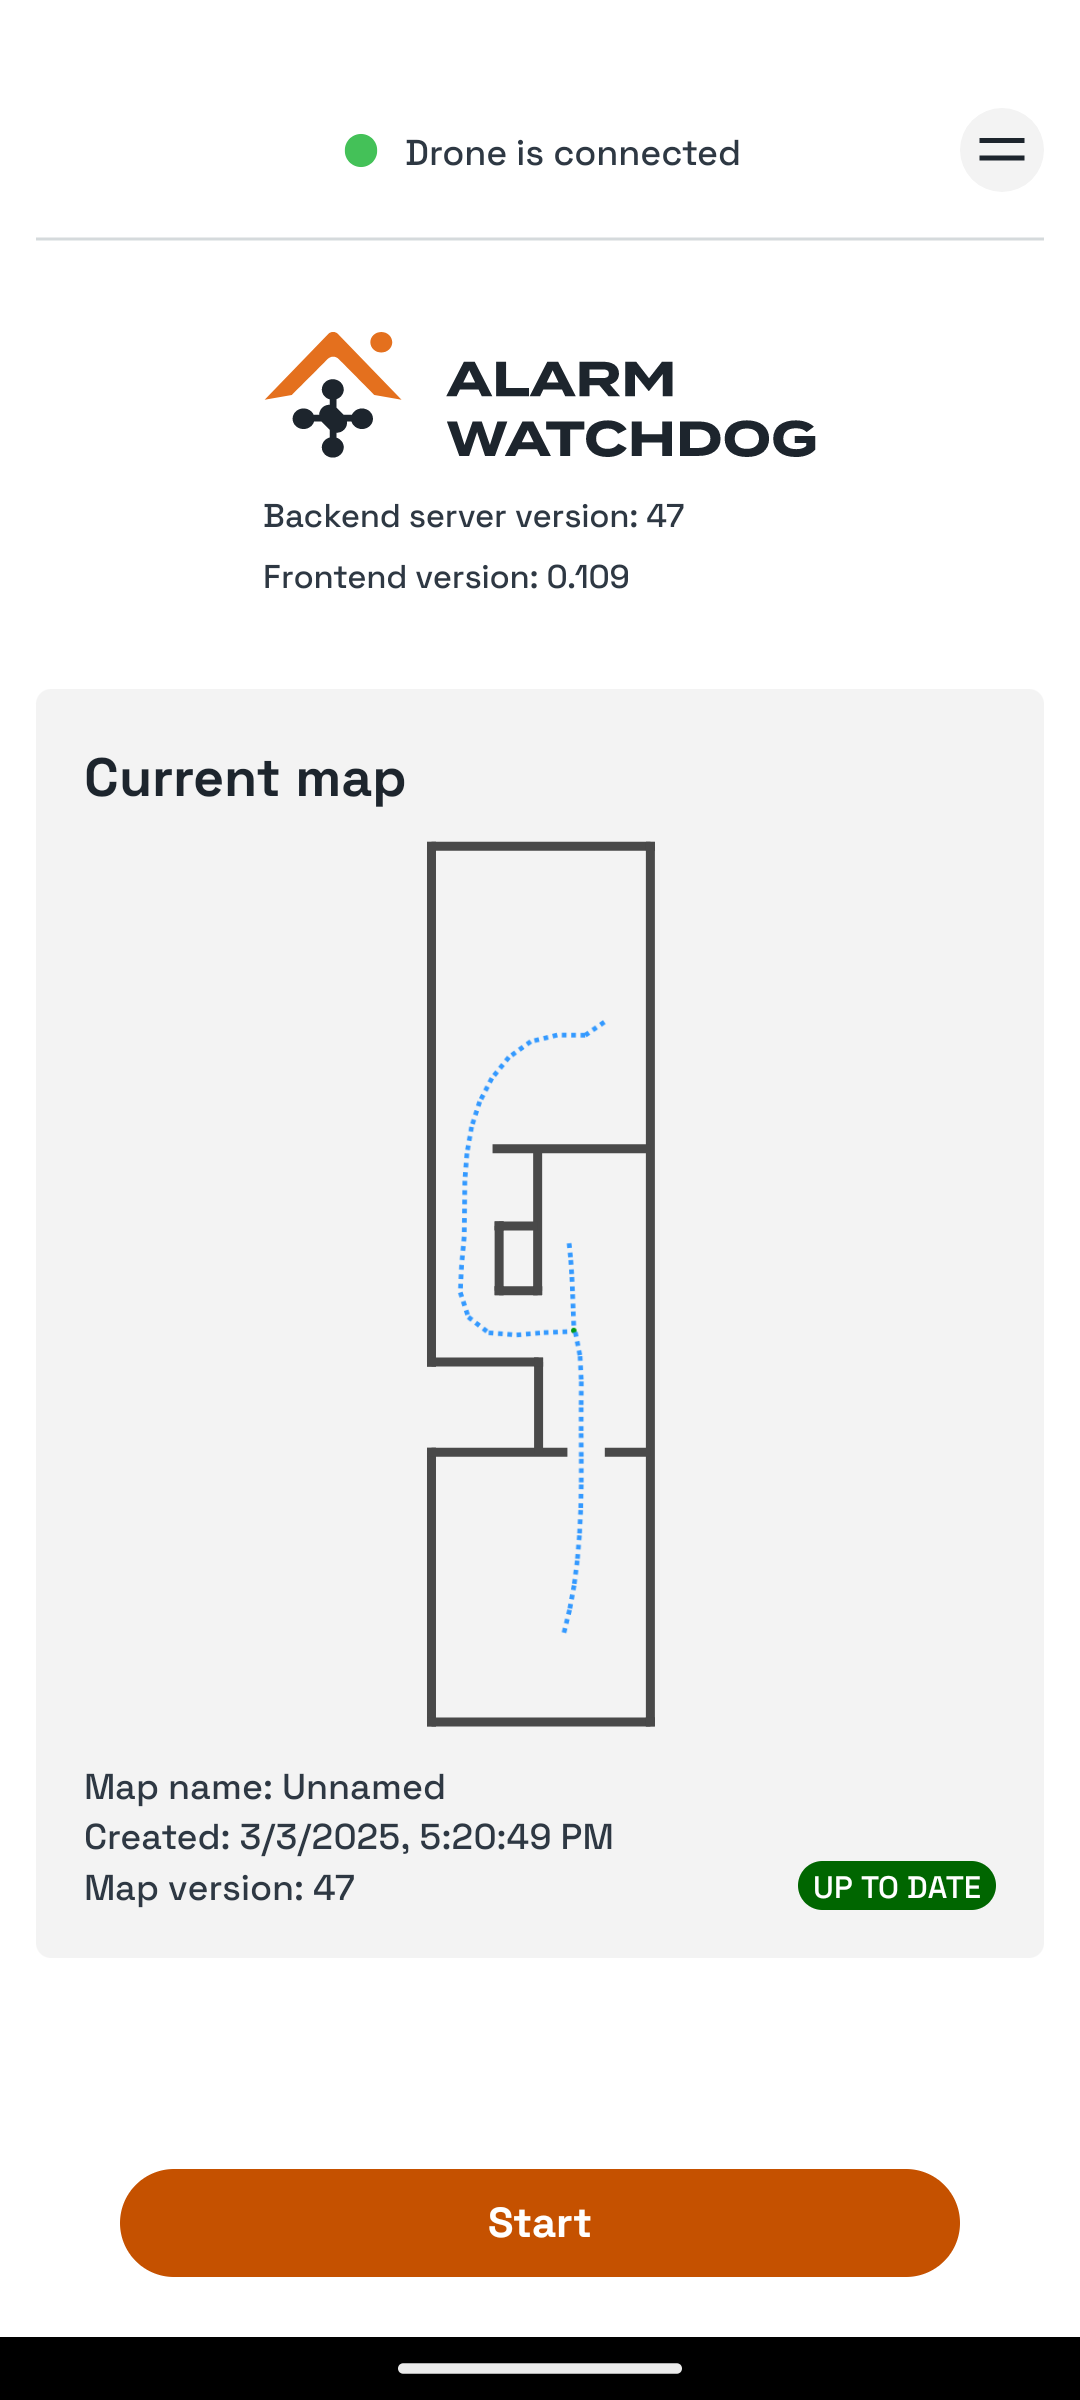
ScreenHome - Main screen that shows list of stored maps and status of the drone connection and status of the backend connection.
ScreenMainMap - Main control screen that allows interaction with the map and mission control.
ScreenMapEditor - Screen that allows to edit map after mapping manually.
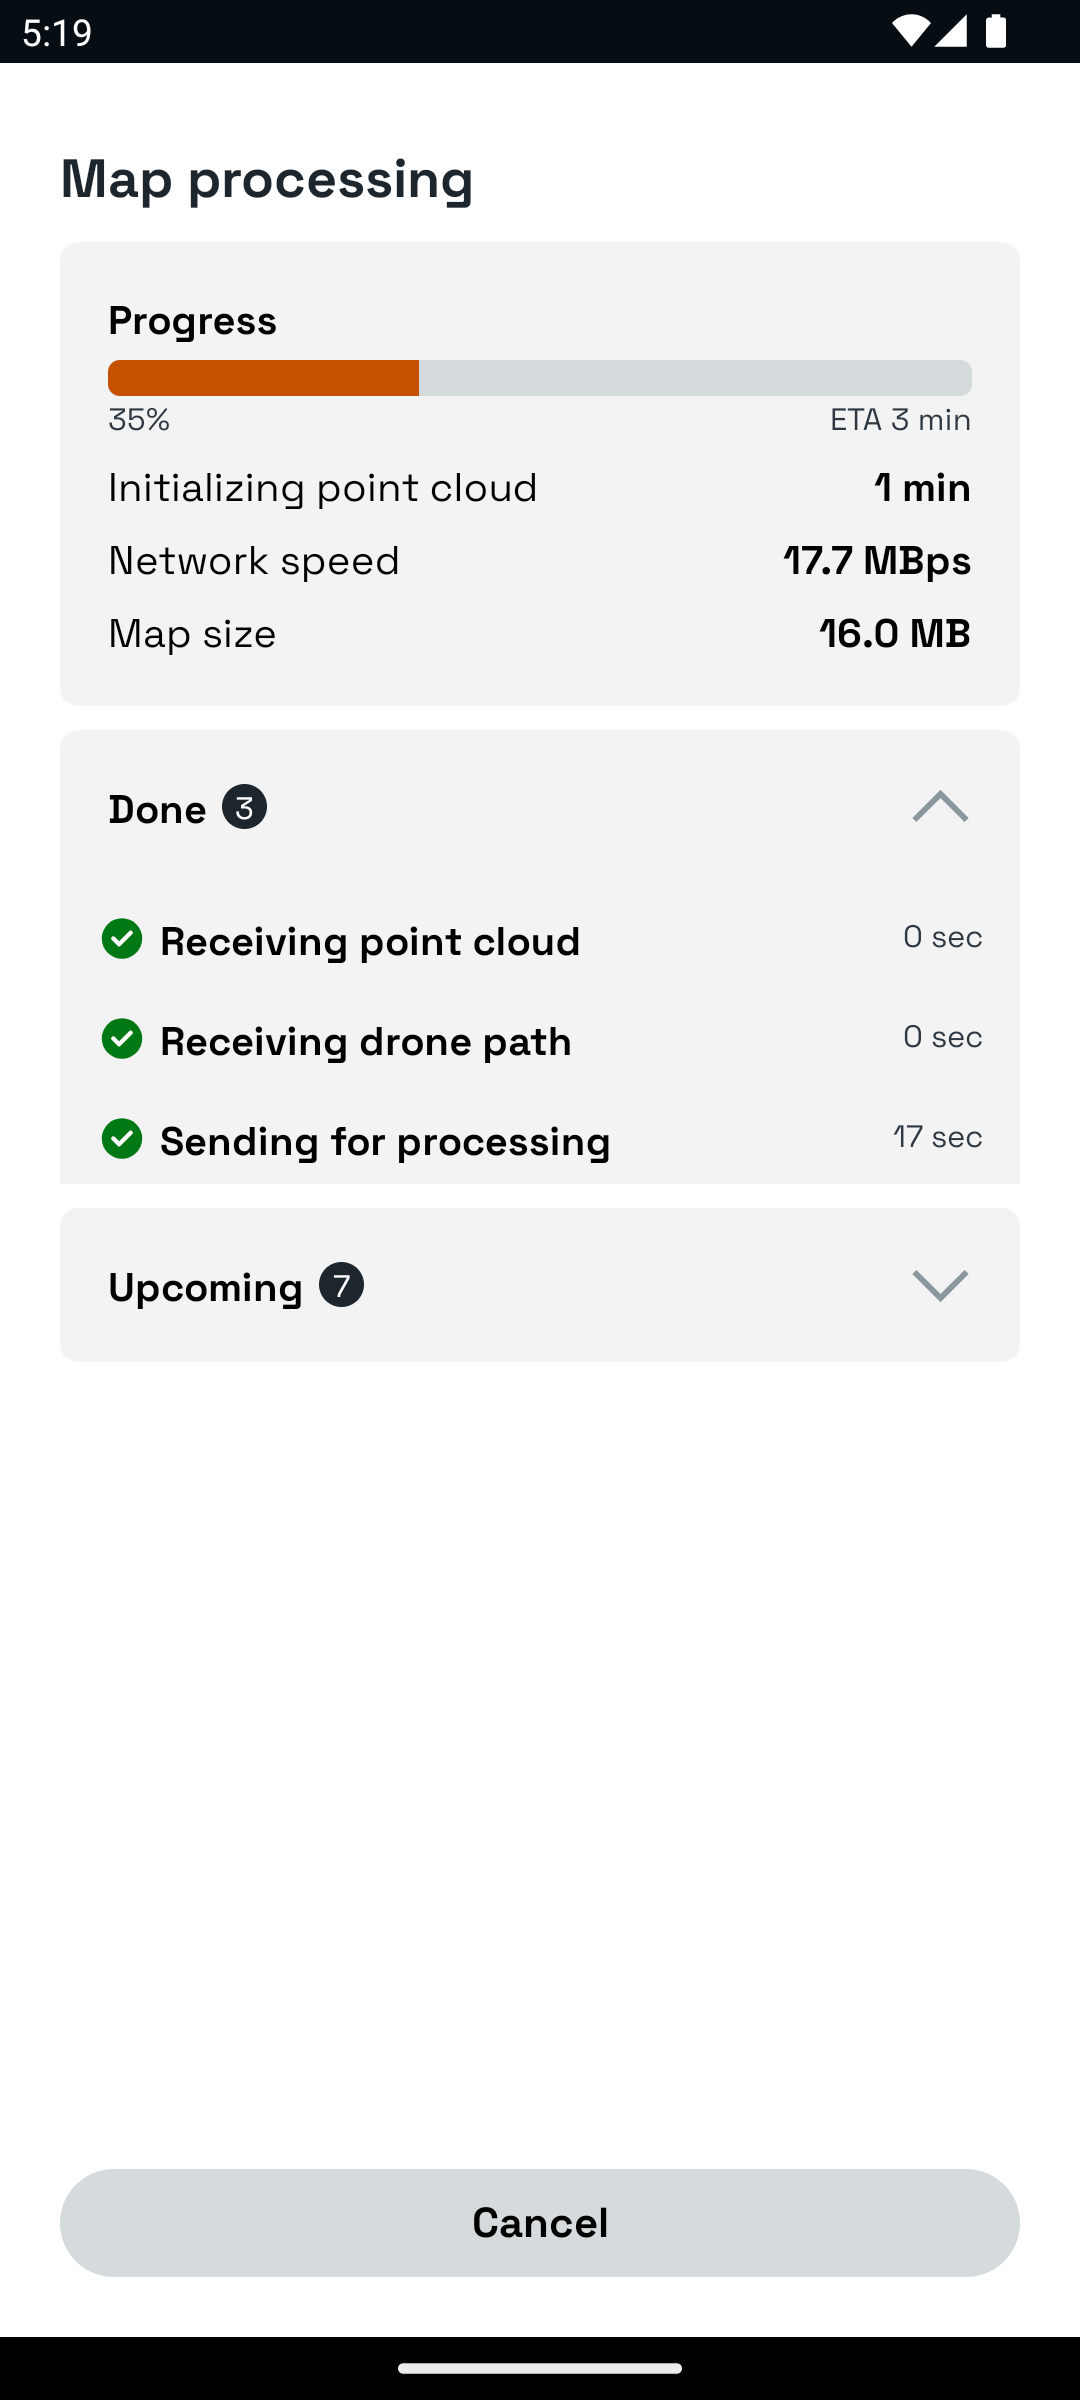
ScreenMappingLoading, ScreenMapping, ScreenMappingTutorial - Screens that guide user through the mapping process.
ScreenMaps - Screen that shows list of stored maps.
ScreenSettings - Screen that allows to configure settings of the app.
ScreenScheduling - Mission scheduling screen for the planned server-side mission control.
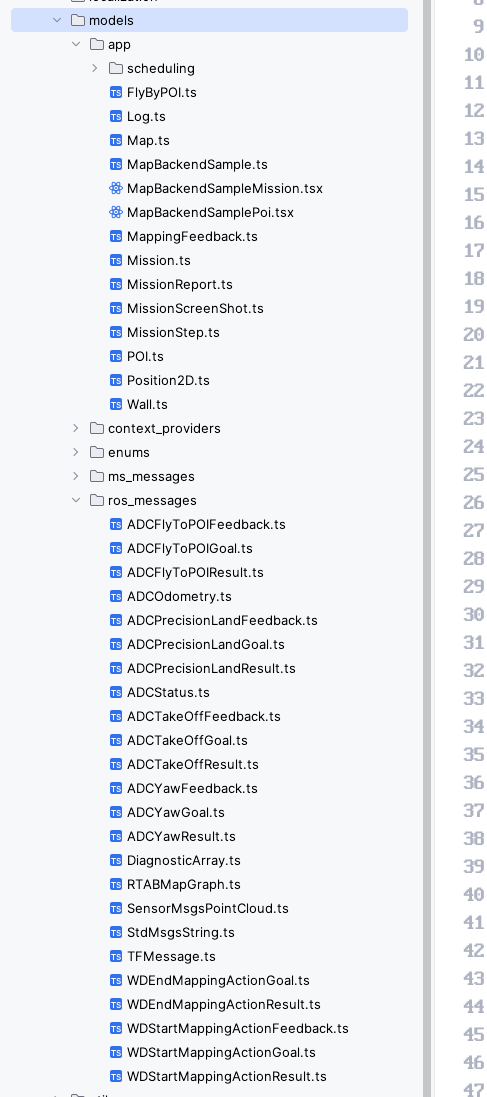
Models contain data structures used for data storage and communication between backend and frontend as well as ROS messages. ROS messages are being received and sent to drone directly from the app in local network using ROS bridge and websocket. All ros topics and actions are controlled using ControllerROS.ts class.
Demo video of operating real-life drone using app https://share.yellowrobot.xyz/quick/2025-3-3-A68E92C0-42FA-4422-9F29-B0B4F837553F.mp4.
After the mapping ScreenMappingLoading screen shows current operations done by the backend system and estimated time it would take to complete these processing steps. It also shows network stability and other data that might be helpful
ScreenHome shows current status of the drone, backend, network and selected map.
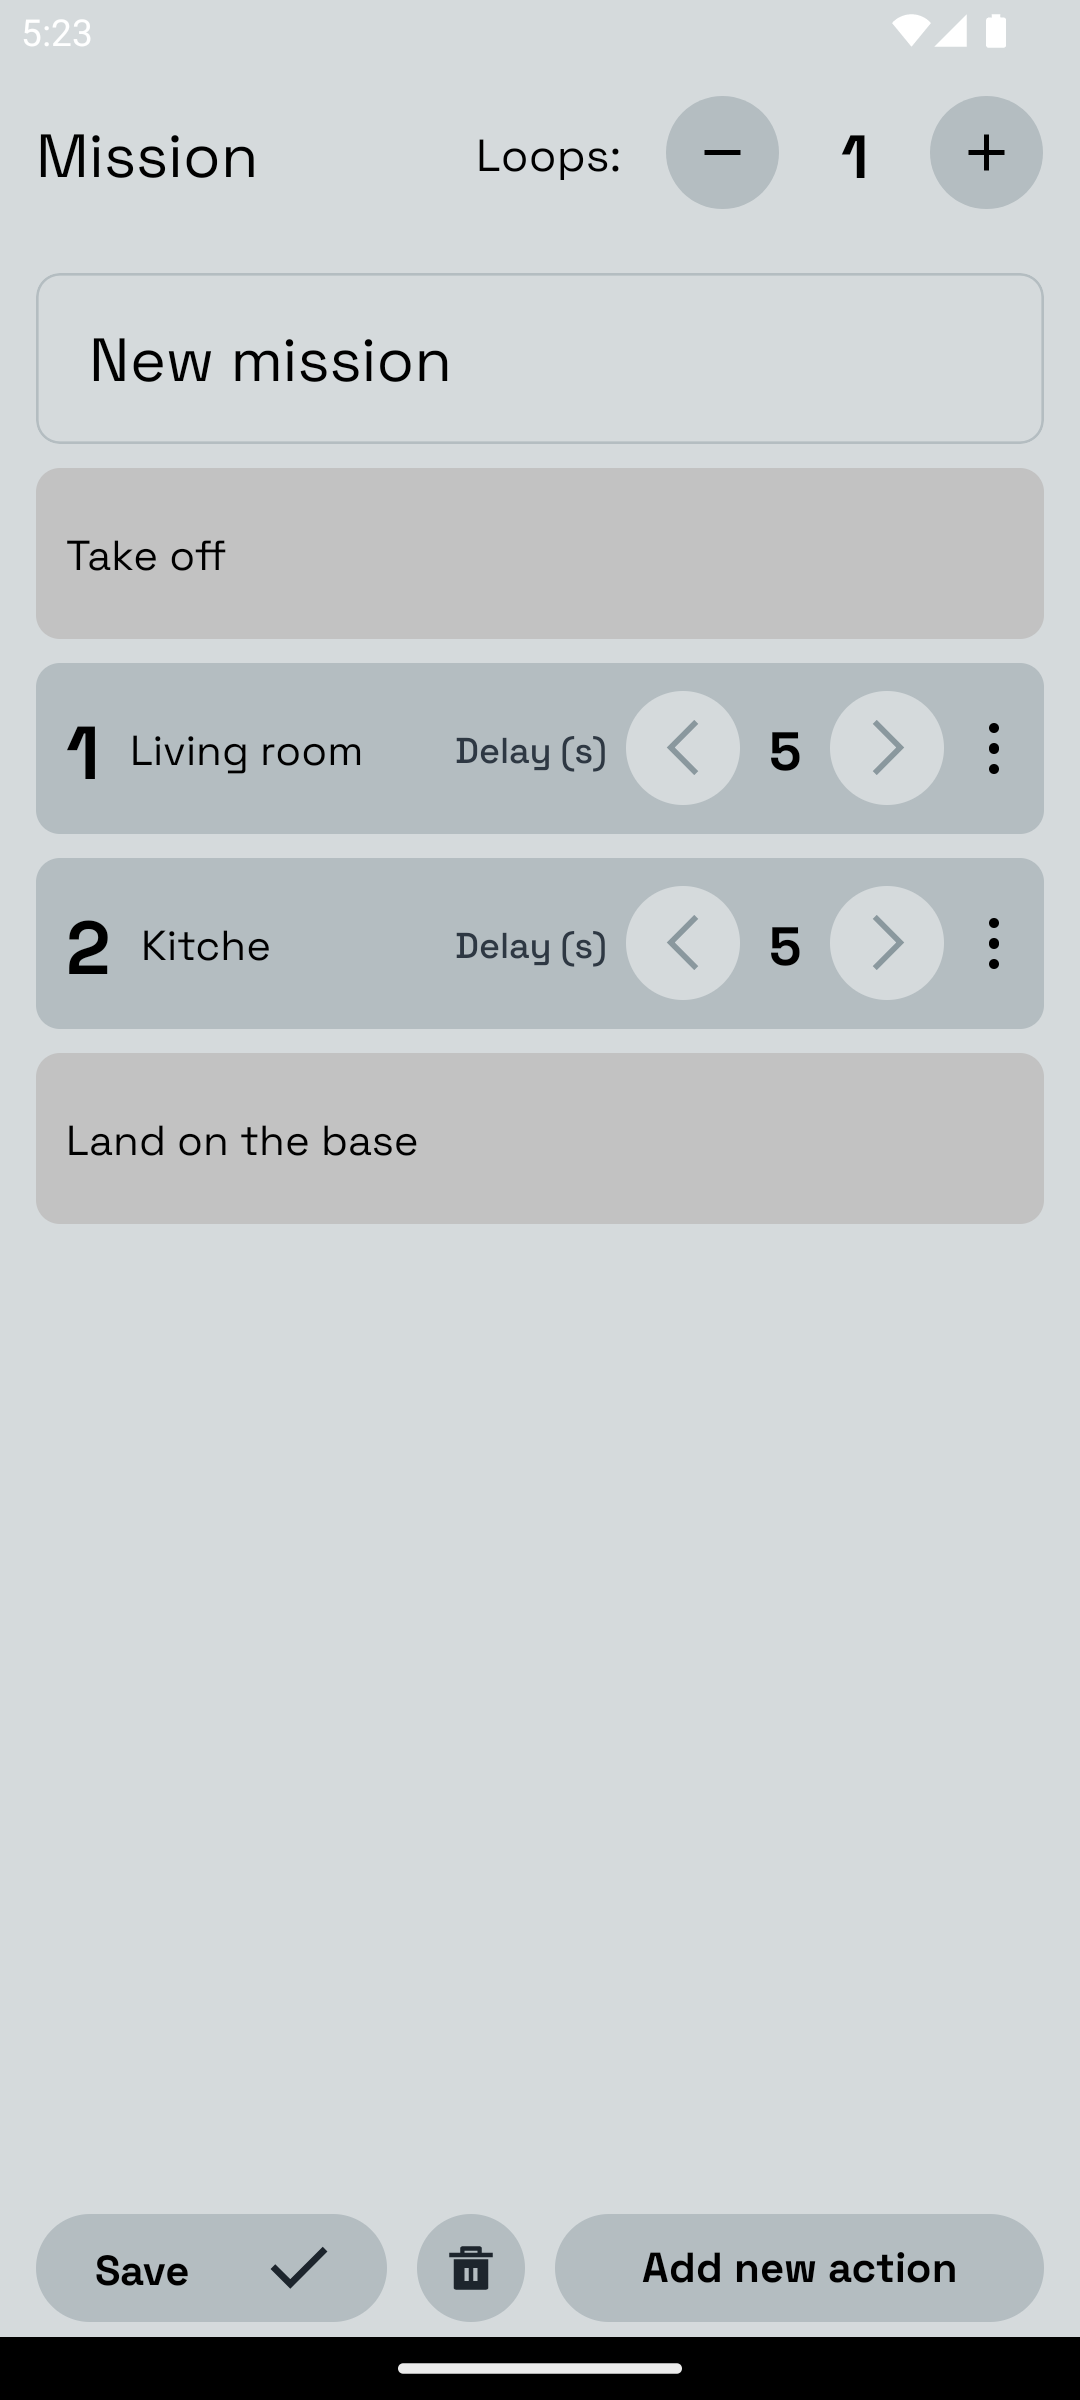
ScreenMainMap shows current odometry of the drone in the GenAI processed map. It also shows POIs (Points of Interest) and is able to execute mission.
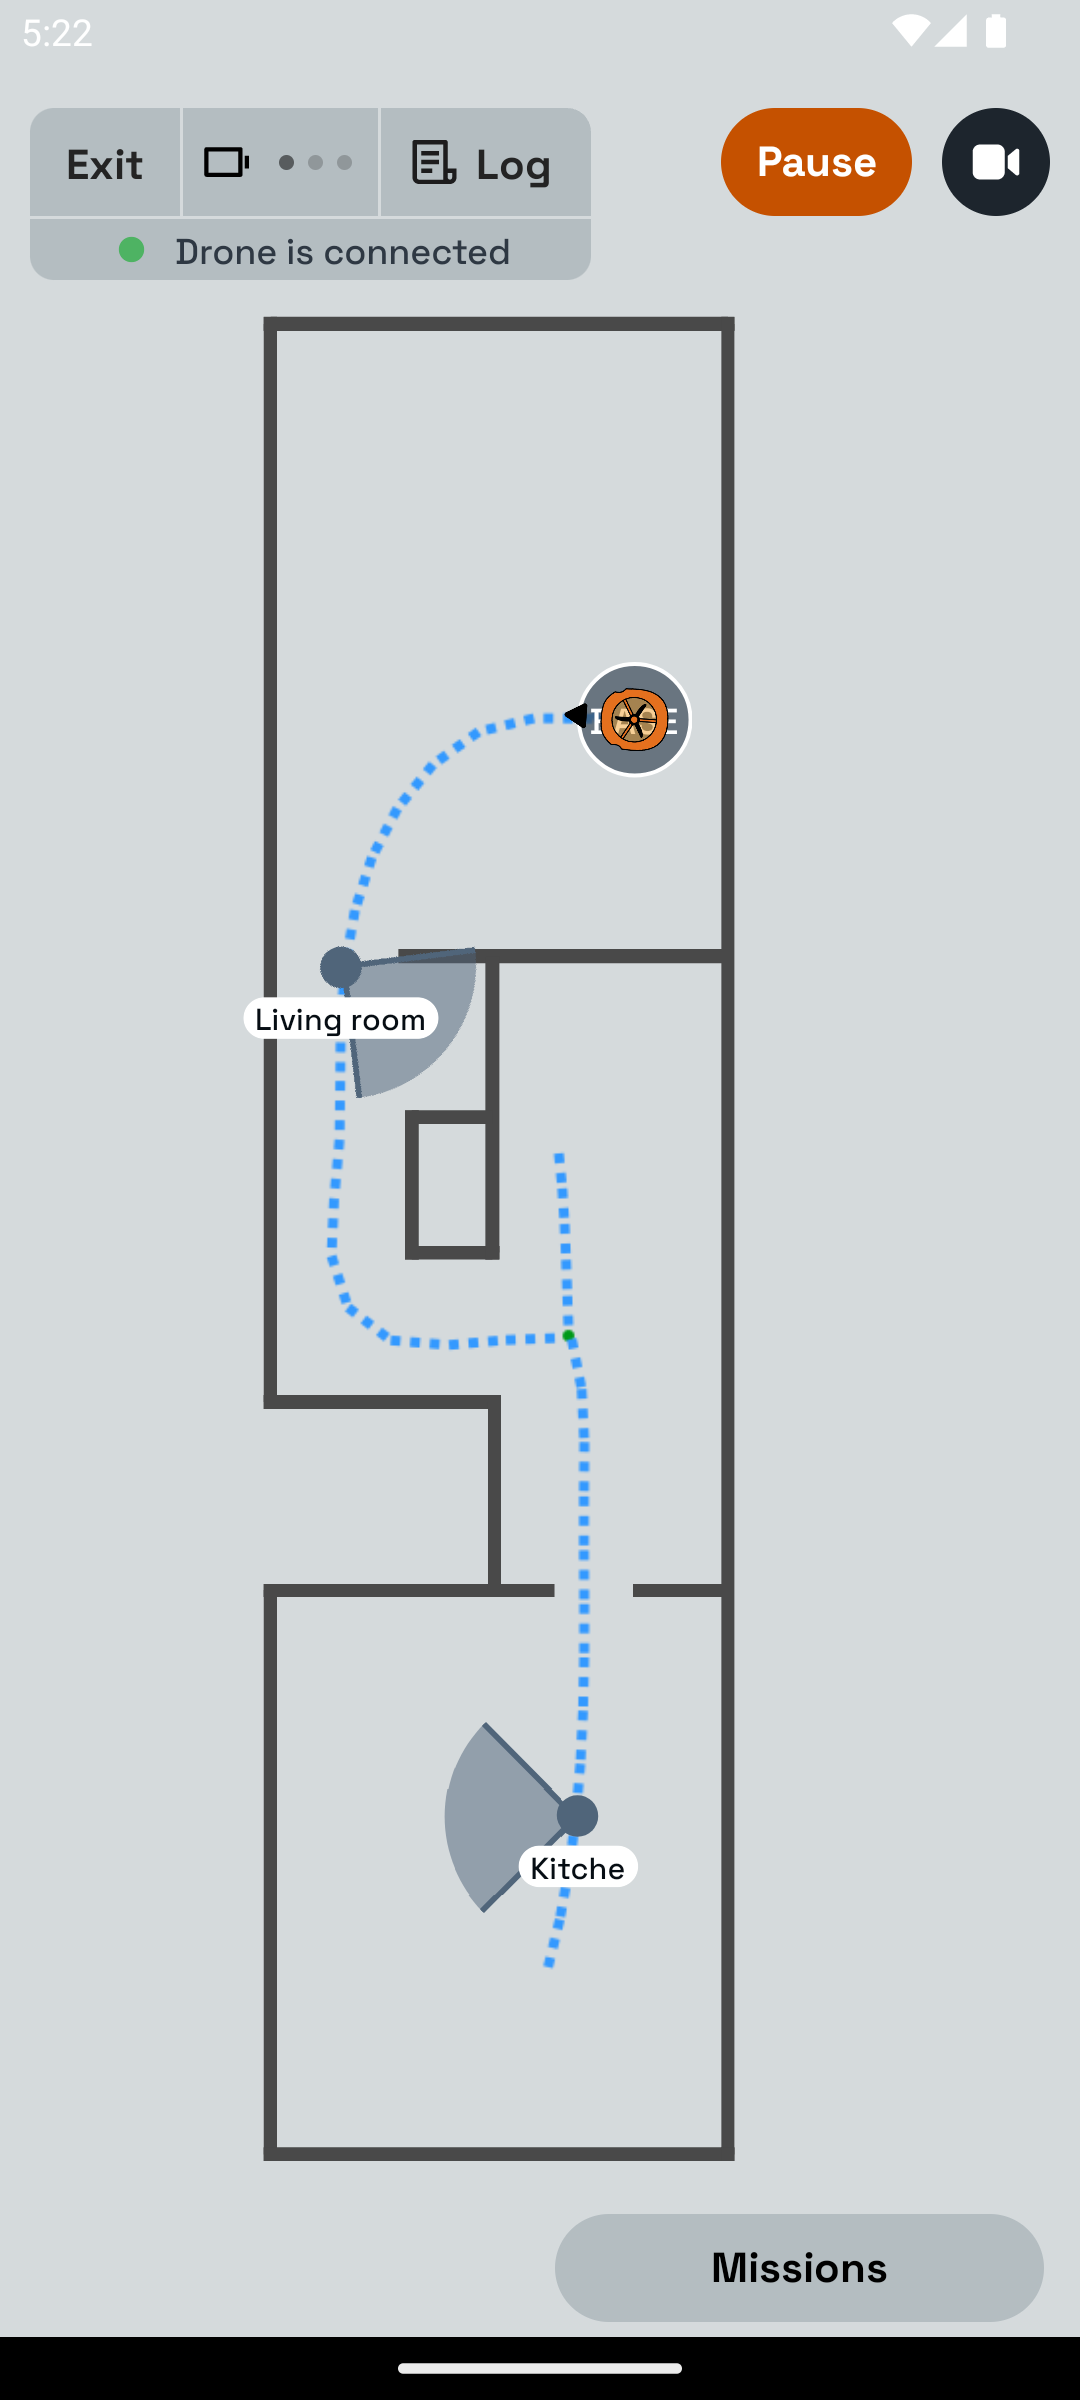
It is also possible to set mission with multiple POIs and actuions in between take off and landing events. During mission drone collects video and photo footage which is then visible in mission reports.
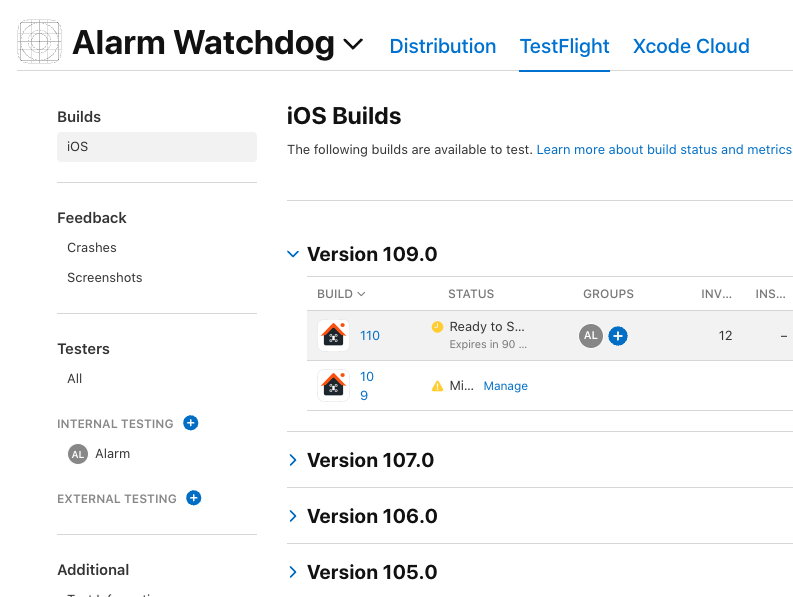
Application versions are deployed to Google Play and Apple App Store.
Google Play version available at: https://play.google.com/apps/internaltest/4700781015890808686
Apple App Store version available in Internal Testing, to access it please contact evalds@asya.ai.
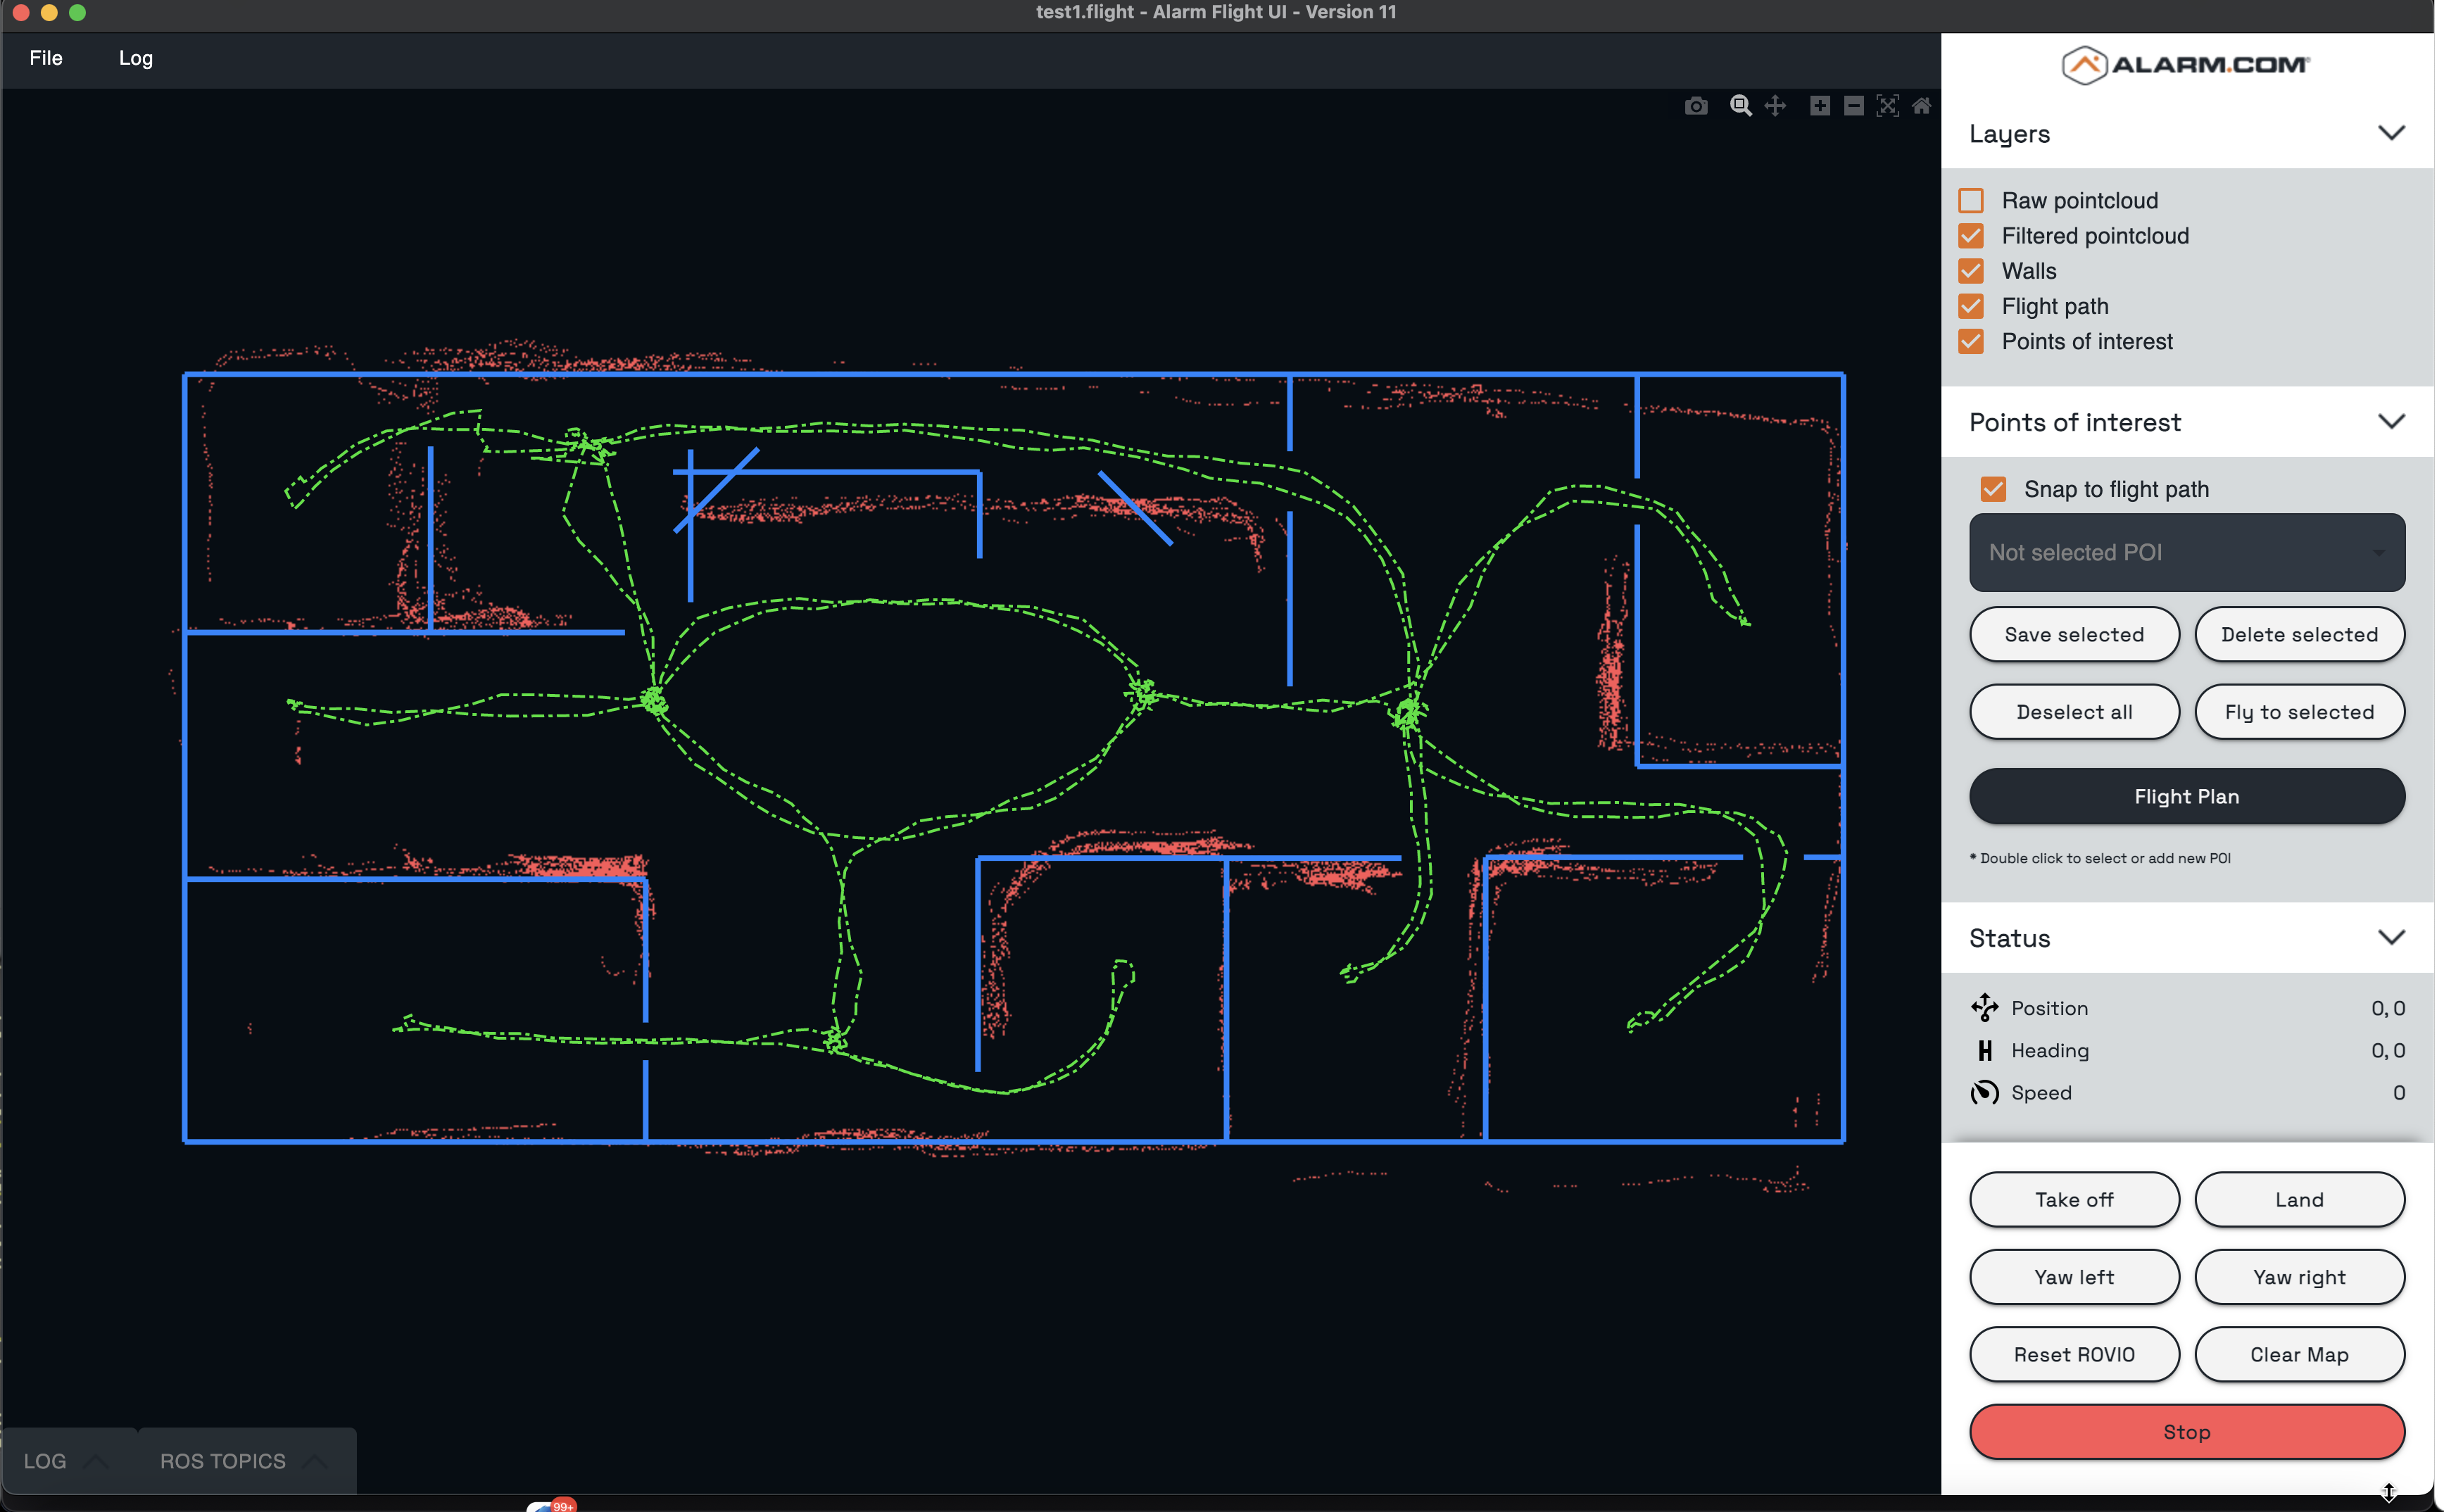
4. Initial Linux-based Watchdog App
Initial app is based on Python and Tkinter UX (alarm_flight_ui_2022_Q1.zip). It works by using ROS (Robot Operating System) and rospy to read ROS data formats. It is able to read mapping data exported to PLY and TXT files (drone trajectory and point-cloud data). Then it process map using AI model and provide enhanced control capabilities of the drone.